|
 mat=diag(1:3)
 layout(mat=mat, widths=rep(1,3), heights=rep(1,3))

 plot(x,y1)
 plot(x,y2)
 plot(x,y3)
|
|
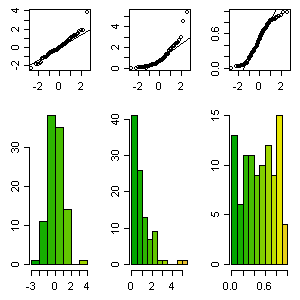
 mat=rbind(
      c(1,2,3),
      c(4,5,6))

 layout(mat=mat, widths=c(1,1,1), heights=c(1,2))

 par(mar=c(3,3,1,1))
 x1=rnorm(100); x2=rexp(100); x3=runif(100)

 qqnorm(x1, main="", ylab=""); qqline(x1);
 qqnorm(x2, main="", ylab=""); qqline(x2);
 qqnorm(x3, main="", ylab=""); qqline(x3);

 hist(x1, main="", col=terrain.colors(18), ylab="")
 hist(x2, main="", col=terrain.colors(18), ylab="")
 hist(x3, main="", col=terrain.colors(18), ylab="")
|
|
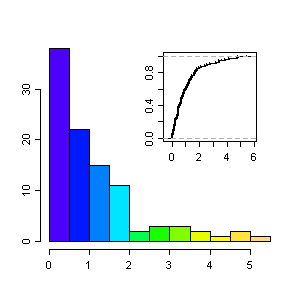
 mat=rbind(
    c(1,1,1),
    c(1,2,1),
    c(1,1,1))

 layout(mat=mat, widths=c(4,4,1), heights=c(1,3,3))

 x=rexp(100)

 hist(x, col=topo.colors(12), xlab="", ylab="", main="")
 plot(ecdf(x), xlab="", ylab="", main="")
|